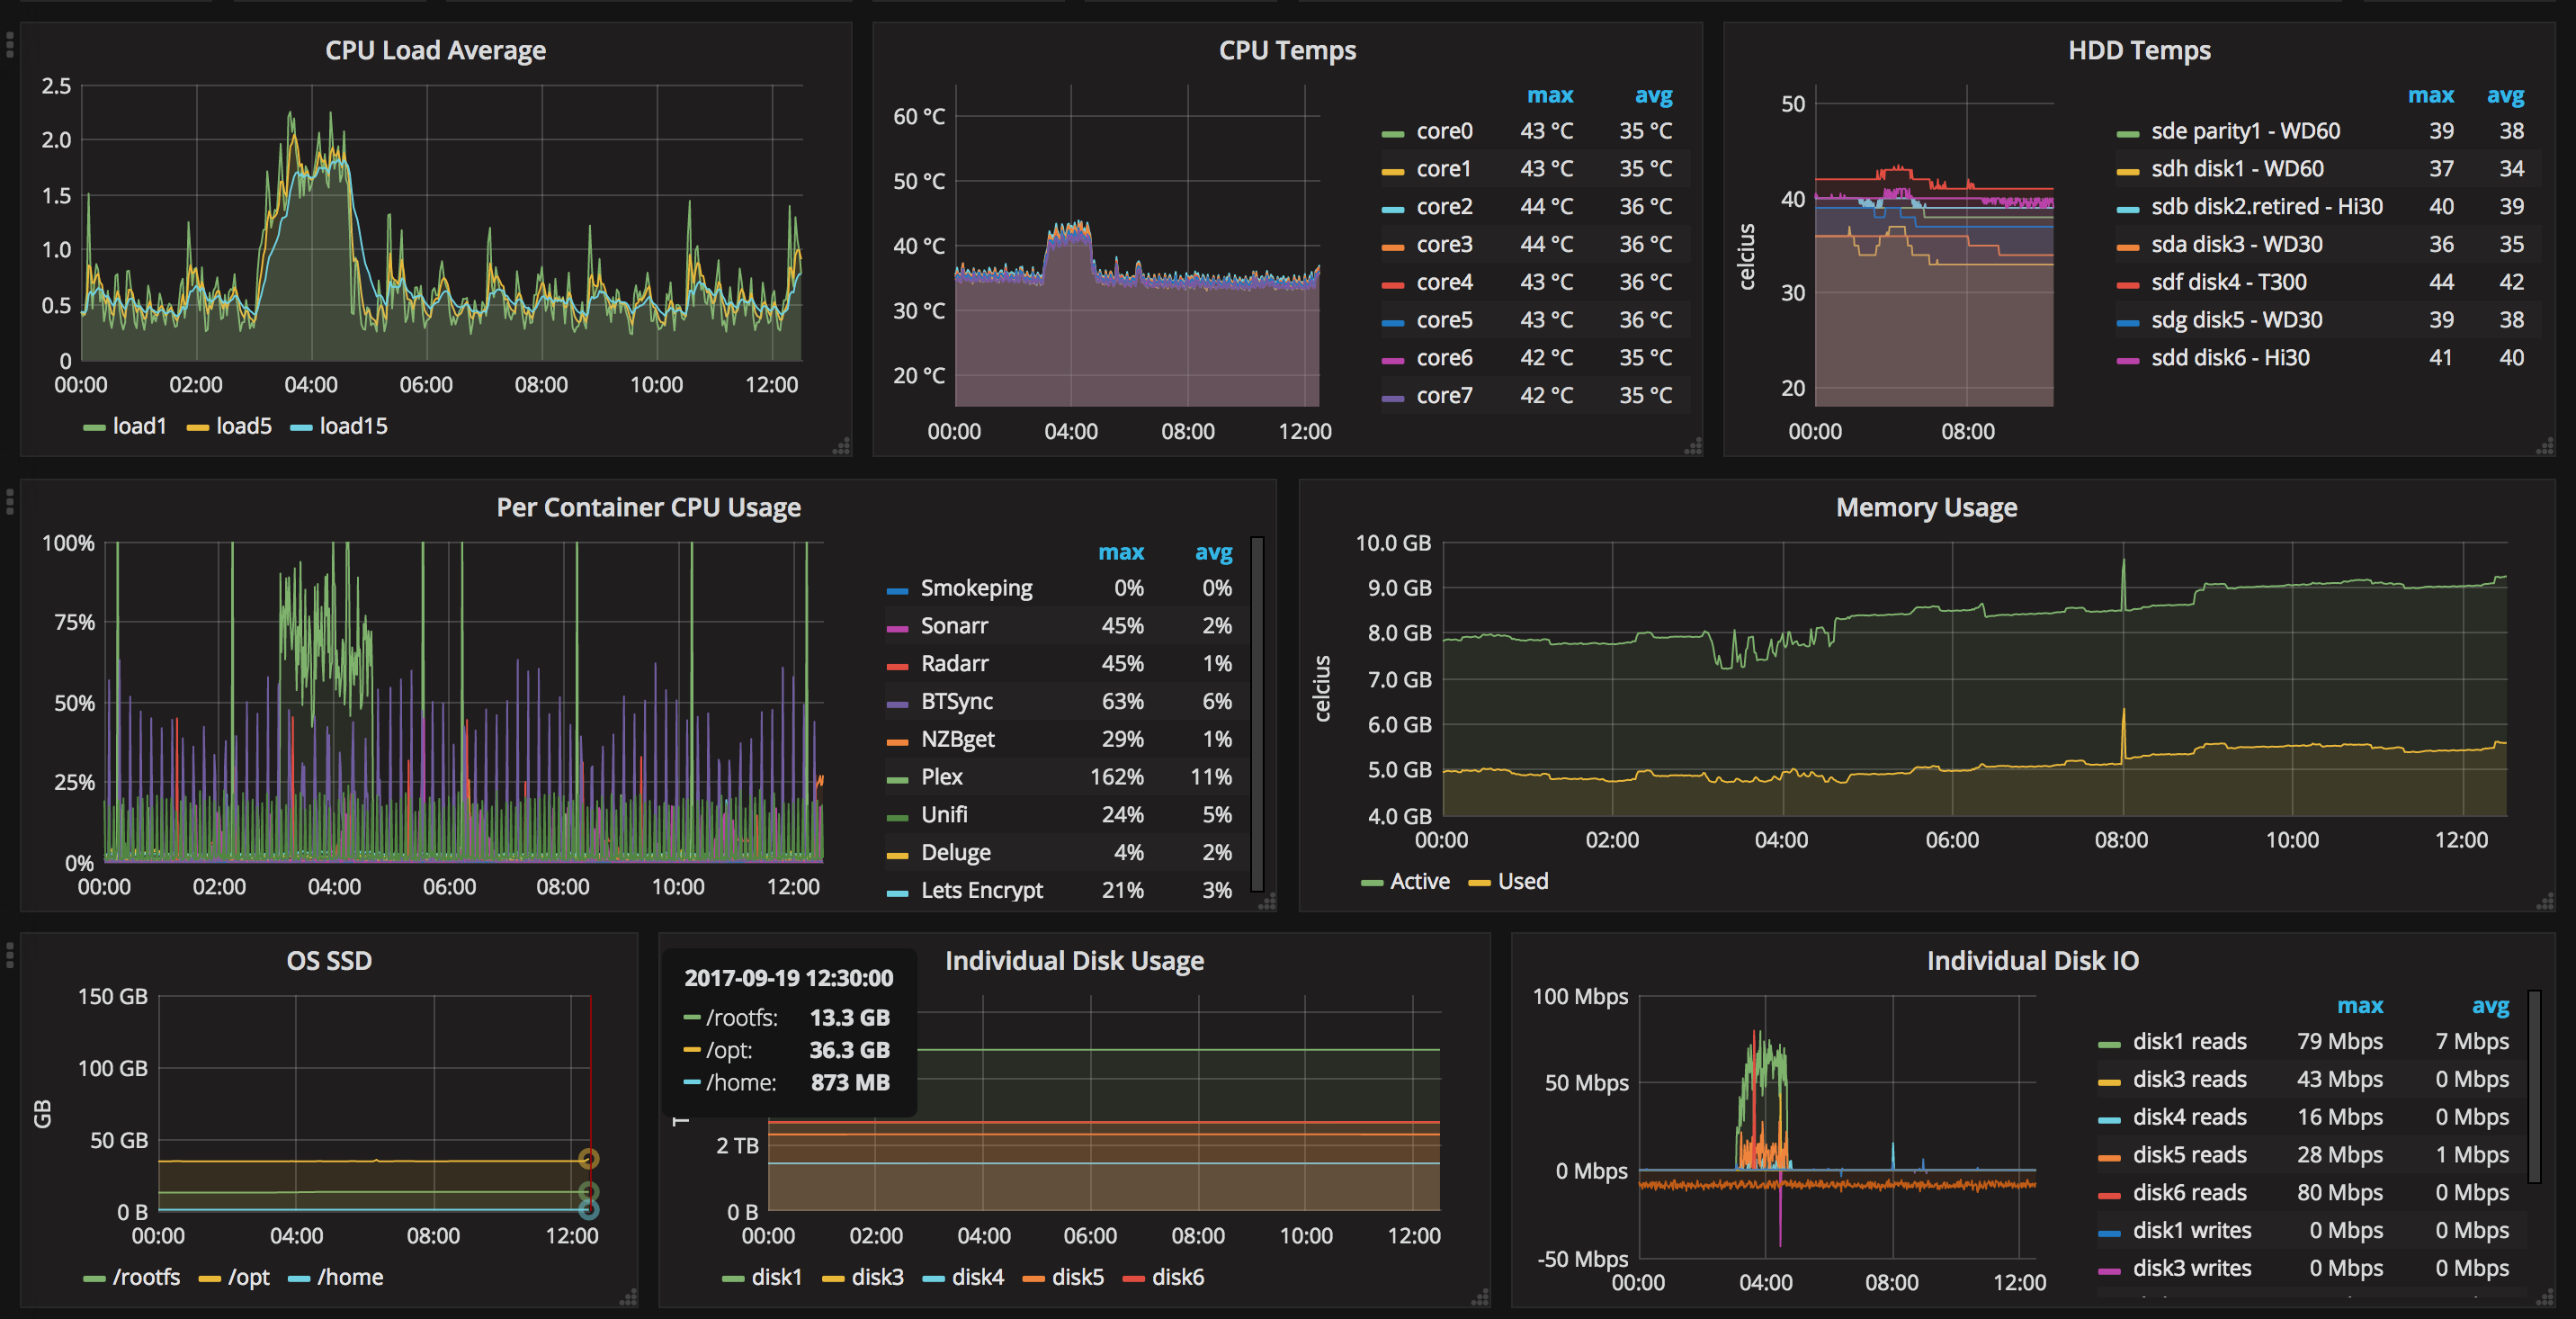
Welcome to a new series of articles that will take you on a journey to generate beautiful looking dashboards using Grafana. We'll take the readings from the metrics the things in your house are already generating such as your home server, IoT devices (Nest thermostat in my case), pfSense firewall, Ubiquiti gear and more. This is a simple yet paradoxically complex and time consuming project. Without further ado, let's dive in!
- Part 1: Setting up InfluxDB, Grafana and Telegraf with Docker on Linux
- Part 2: Monitoring a UPS with Grafana on Linux
- Part 3: Grafana integration with 3rd party services such as Nest and weather.com - coming soon

The TIG stack
True to form we will be deploying most of the "TIG" (Telegraf, InfluxDB and Grafana) stack using docker. I experimented with using Telegraf in a docker container. It worked well but the list of volumes to mount in order for it function made me uncomfortable, including the docker socket. I ultimately ended up installing the Telegraf agent directly onto my Debian and pfSense hosts instead.
Let's begin with InfluxDB and Grafana. I'm using a debian host as described in my perfect media server series but you can use just about any docker capable host. I also make use of docker-compose to manage my containers and will provide example .yml snippets below.
We use InfluxDB to store all of our data points. The data points are collected using collectors, in our case Telegraf and some scripts. These write time-series data to the DB collecting the metrics we want to display using our front-end, Grafana.
InfluxDB
There is an official InfluxDB container on docker hub. This is the one we'll use. In order for our time series data to survive, we must persist that data outside the container using a volume. If you don't do this every time the InfluxDB container is recreated you will loose data.
# snippet from docker-compose.yml
  influxdb:
    image: influxdb:latest
    container_name: influxdb
    ports:
      - 8086:8086
    volumes:
      - /opt/appdata/influxdb:/var/lib/influxdb
    restart:
      always
The only other thing of note with InfluxDB is that the default username and password is root/root. We're listening on port 8086, though you can change this if you wish. You'll need this information when setting up Telegraf later.
Grafana
Similarly there is an official Grafana container on docker hub. This is the one we'll use. Port 3000 on my system was taken already by ntop so I changed the listening port to 3001, you may or may not need to change this but it is the port you'll be visiting in your browser to view your graphs so take note. Again, we persist data using volumes so that our configurations survive a recreation of the container.
# snippet from docker-compose.yml
  grafana:
    image: grafana/grafana
    container_name: grafana
    ports:
      - 3001:3000
    volumes:
      - /opt/appdata/grafana:/var/lib/grafana
    restart:
      always
Start the stack
Combine both of the snippets above into a single docker-compose.yml file as per my example file on github. Now, we can start Grafana and InfluxDB.
docker-compose -f /opt/docker-compose.yml up -dUsing a browser navigate to http://<server-ip>:3000/, login to Grafana and add a datasource.

Telegraf - Debian installation
We'll use Telegraf to gather the actual metrics themselves and feed them into InfluxDB. Installation of Telegraf on Debian takes a few steps.
# Download the key
curl -sL https://repos.influxdata.com/influxdb.key | sudo apt-key add -

# Add the repo
echo "deb https://repos.influxdata.com/debian stretch stable" | sudo tee /etc/apt/sources.list.d/influxdb.list

# Update sources, install and start telegraf
sudo apt update && sudo apt install telegraf
Once Telegraf is installed you'll need to configure it using /etc/telegraf/telegraf.conf. My full, working configuration file is available on Github here.
Installing some applications to allow you collect various metrics might be useful.
apt install hddtemp lm-sensorsThe primary thing you'll need to do is go through the file and enable the various [[inputs.hddtemp]] sections as per your requirements. Enabling is as simple as uncommenting (removing the #). Then once you're happy restart the telegraf service with:
systemctl restart telegraf
systemctl status telegraf -l
Check the logs for any errors. Common ones include not having the correct packages installed for certain plugins such as lm-sensors, etc. The error messages are pretty helpful and a bit of quick googling should resolve anything you're stuck with here. LSIO has also just launched a new Discord server which you're welcome to frequent it if you're having any issues as well.
Connecting it all together
Now we have the core components of our TIG stack setup it's time to create your first graph in Grafana.
Using the magic of exporting JSON from my dashboard it's actually really simple. At this link you can find my dashboards JSON.
When you first login to Grafana you will need to create a dashboard.

The next page will let you copy and paste the entire JSON structure into it. Do this and then you'll have my dashboard.
Now, this on it's own will get you most of the way there but you will need to edit each pane and panel as it's obviously customised for my setup.

Most of this stuff is just point and click. Trial and error will get you most of the way hopefully from the example provided. Any issues, head on over to the Discord.
Bibliography
The following collection of links, in no particular order, was used in the creation of this series.
- https://kodewolf.com/blog/telegraf-influxdb-and-grafana-experience-with-docker/
- https://www.jacobtomlinson.co.uk/monitoring/2016/06/23/running-telegraf-inside-a-container/
- https://github.com/containerize-my-server
- https://collectd.org/wiki/index.php/Plugin:HDDTemp
- https://hub.docker.com/r/derf/nest_poller/
- https://github.com/jverdeyen/docker-nest-dashboard
- https://www.reddit.com/r/PFSENSE/comments/5gq7o7/telegraf_to_influxdb_snmp_polling/
- https://danlimerick.wordpress.com/2017/01/29/graphite-and-grafana-how-to-calculate-percentage-of-totalpercent-distribution/
- https://github.com/tylerhammer/grafana/tree/master/Data%20Collection
- https://grafana.com/dashboards/1486
